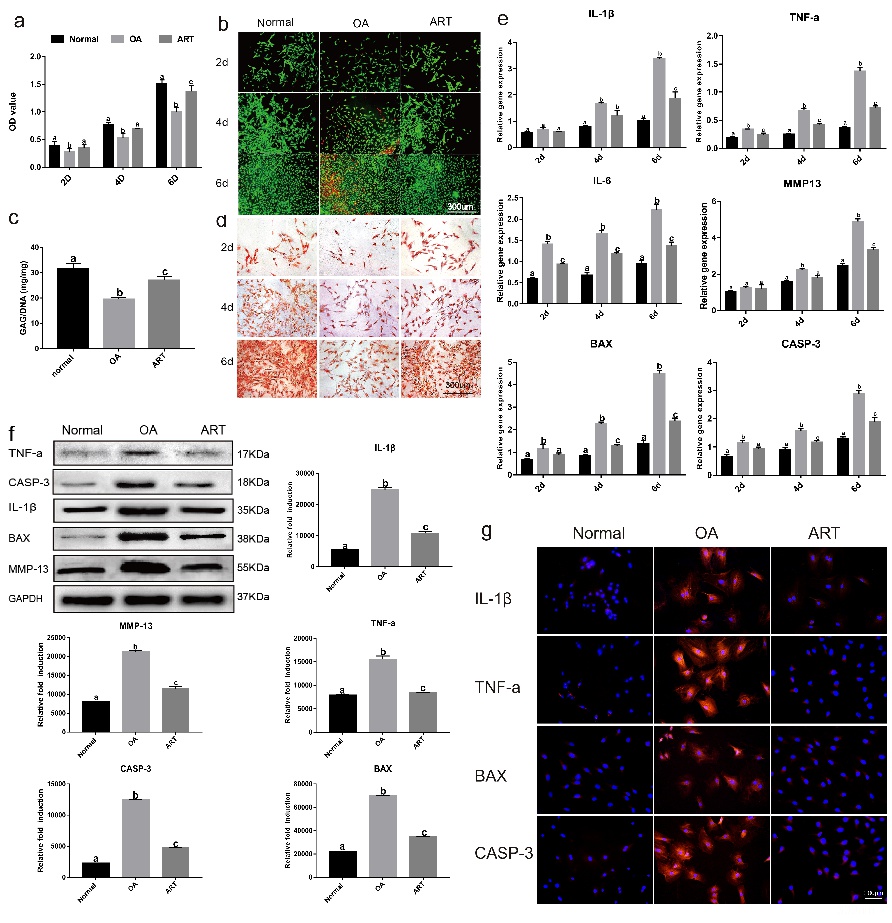
Fig. 2. Chondro-Protective and Antiarthritic Effects of ART on human OA chondrocytes in vitro. (a) MTT assay was implemented to detect the cell activity; (b) FDA/PI staining for cell viability; (c) Quantification of intracellular production of GAG (n=5). (d) Safranin O stained for GAG production. (e) Real-time RT- PCR was performed to determine the gene expression level of IL-1β, TNF-α, IL-6, MMP-13, BAX and CASP-3. (f) Western blot was performed to determine the protein expression level of IL-1β, TNF-α, MMP-13, BAXand CASP-3. (g) Immunofluorescence staining of IL-1ß, TNF-a, BAX, CASP-3. Normal (normal human chondrocytes), OA (human derived OA chondrocytes), ART (human derived OA chondrocytes treated with 4ug/mL artemisinin). Values are presented as the means ± SD, n=6, different letters denote significances with P<0.05 and the same letter shows no significant differences (P = 0.05).